
How Do Interpret PSAT Scores?
In October 2015 the College Board released a newly redesigned PSAT that changes both scoring and content. This coincides with the new SAT being released in the spring of 2016.
Our purpose here is to review the scoring elements of the Preliminary SAT/National Merit Scholarship Qualifying Test.
This can be confusing so we will explain it as if we are reviewing the new test score report that is available online and a paper copy is sent to the student’s school on January 29, 2016.
First we are going through the test mechanics; sections, time allowed, and total questions. Then we will review the scoring results with scoring ranges.
Test Mechanics: Sections, Time, Questions
The three test scores are converted to two section scores explained below.
Critical Reading;
- 60 minutes allowed
- 48 total questions
Writing skills;
- 35 minutes allowed
- 44 questions
Total Score Possible this Section (Reading/Writing Together): Scaled 160 to 760
Math Section;
- 70 minutes allowed
- 47 total questions
Total Score Possible this Section: Scaled 160 to 760
Total Time: 165 minutes which is 35 minutes longer than the old PSAT
Total Questions: 139
Scaled scoring uses a process called “equating” to arrive at the range of 160 to 760. Equating adjusts for slight differences in difficulty between various versions of the test (such as versions taken on different days).
What Happens When You “Guess”?
Each correct answer earns one point. There is no penalty for guessing so you should answer all questions. There are now four multiple answer opportunities versus five so when you do guess your chances improve.
Scoring Report Data Overview
- Scoring of two sections (one reading/writing tests combined, two math) with total score
- Shows level of college readiness with color coded graphs
- NMSC Selection Index
- Skill Insights
- Summary of actual test answers showing right/wrong plus scoring breakdown
Here is an overview of what you should understand about your PSAT Scoring results.
Possible Scores and Total Score Results?
There are two broad section scores with a total score.
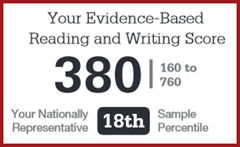 Evidenced based reading, writing and language with scoring ranges from 160 – 760,
Math with scoring ranges from 160 – 760.
Total score range 320 – 1520 (reflects projected SAT score on that day starting March 2016)
Each score above equates to “Your Nationally Represented Sample Percentile”.
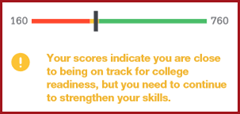 The two subject sections show a college readiness bar graph with your score position for preparedness .
The College and Career Readiness Benchmark
- Test Scores Reading, Writing, and Math range 8 – 38 each subject.
- Cross-Test Scores for history/social studies and sciences anlaysis skills range 8-38.
- Sub-Scores measure their own score range 1-15; commands of evidence, words in context, expression of ideas, standard English conventions, heart of Algebra, problem solving and data analysis, and passport to advanced math.
- Green – You meet or exceed the benchmark for college readiness,
- Yellow – You are approaching the benchmark,
- Red – You need to strengthen these skills.
When you reach your grade-level “Benchmark” it means you are likely on tract to be ready to succeed in select first-year credit worthy college courses.
Your NMSC Selection Index
The National Merit Scholarship Corporation uses a selection index as an initial screening of students who enter their scholarship program from PSAT/NMSQT test results.
How is it calculated? The index comes from the three “test results” not the two section results. As referenced above, there are three test results ranging from 8 to 38. Let’s say your individual test results are 30, 29, and 34. You add these three test results and multiply by two (30 + 29 + 33) * 2 = 184
Skill Insights
This section lists your three individual test scores and provides skills that you are likely to already know and skills that you should consider improving.
Your Question-Level Feedback Answer Summary
Each question is listed with your answer if correct or if wrong the correct answer. It is broken down into four section;
- Reading
- Writing and Language
- Math with Calculator
- Math without Calculator
There is an answer key in addition to providing detailed information for each question showing which questions contributed to the sub-scores / cross-tested score skills.
Raise Your Possible PSAT Scores
Over 350 Online Videos 30+ Hours Tutor Instruction
Click for PSAT Practice

 How to